Create Science & Nature level science drawings
in seconds.
AcaDraw lets you create science drawings in seconds using powerful AI with just your words. Ideal for prototype diagrams, presentations, and publication-ready scientific figures.
ACADEMIC GALLERY
Explore Our Collection of science drawings
Browse through a curated gallery of professional scientific and nature illustrations generated with AI-powered tools.

Draw a Michaelis–Menten curve, mark Km and Vmax clearly, add a small inset in the top right showing the Lineweaver–Burk plot, axis titles and units clearly labeled, use vibrant colors for the curve (e.g., blue or red), dark colors for axes and labels, clean white background, high contrast, professional color scientific chart style
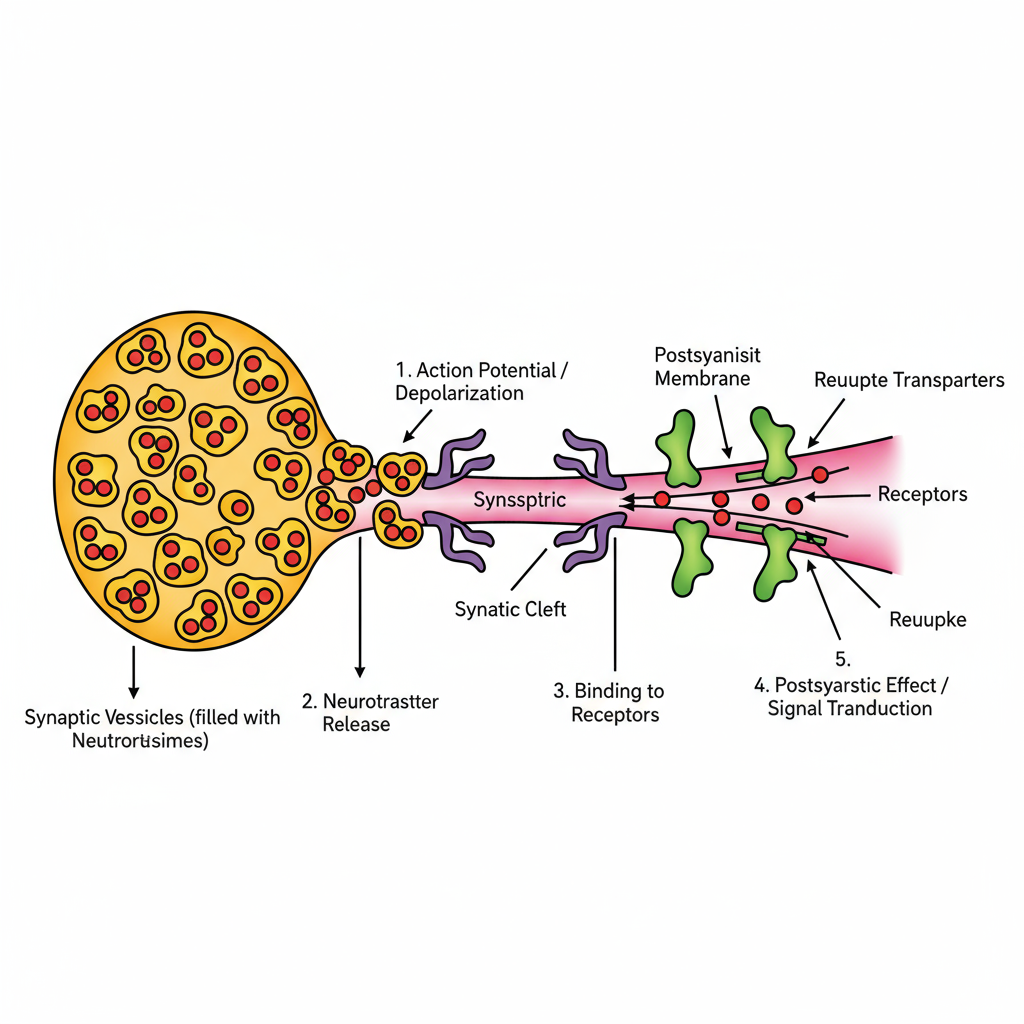
Draw a synapse schematic showing presynaptic vesicles, receptors, reuptake process, add sequence arrows and labels, fill vesicles in yellow or orange, neurotransmitters in red or blue, receptors in green, postsynaptic membrane in pink, use vibrant color fills, clean white background, high contrast, labeled callouts with leader lines, professional color scientific illustration
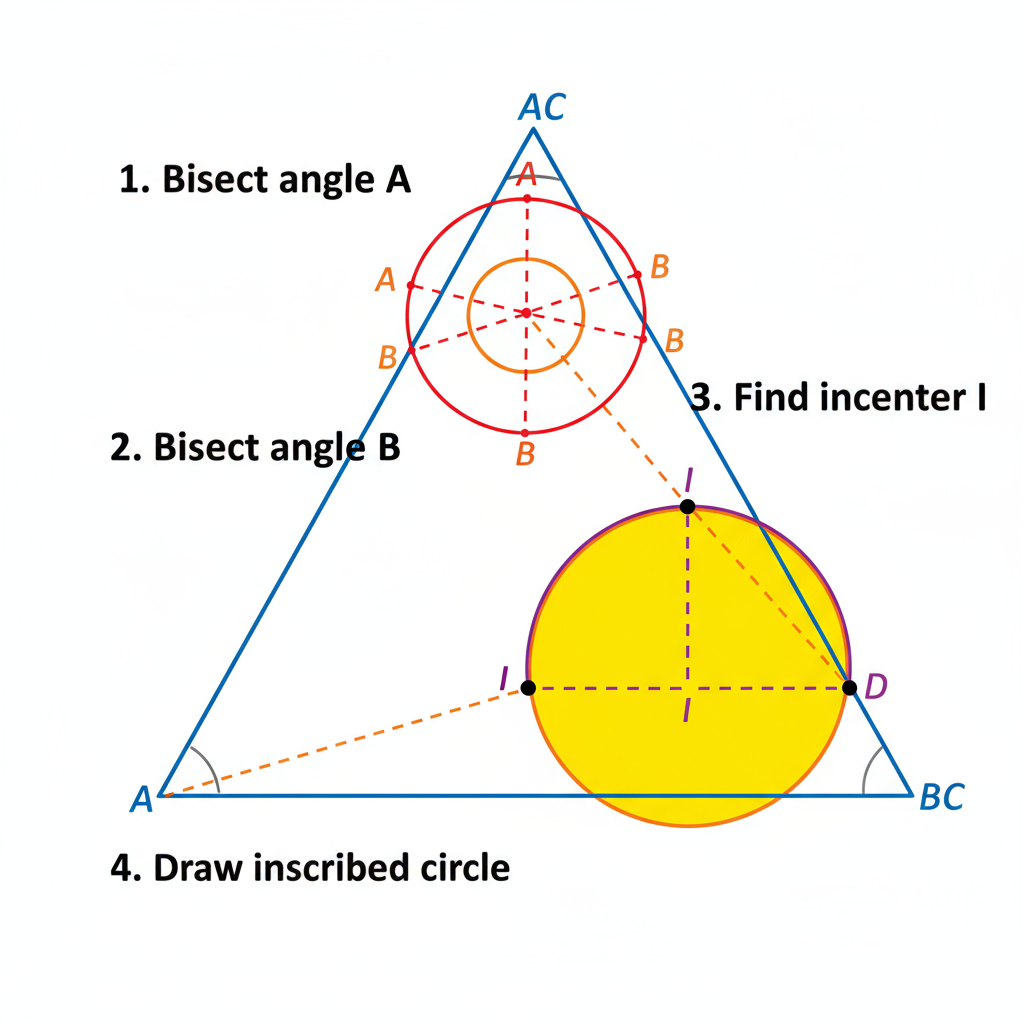
Draw a construction diagram for the inscribed circle of a triangle, compass-and-straightedge style, annotate each step, draw triangle in blue or green lines, use different colors for compass marks (e.g., step 1 in red, step 2 in orange, step 3 in purple), fill final circle with vibrant color (e.g., yellow or pink), use vibrant color fills, clean white background, high contrast, professional color scientific illustration
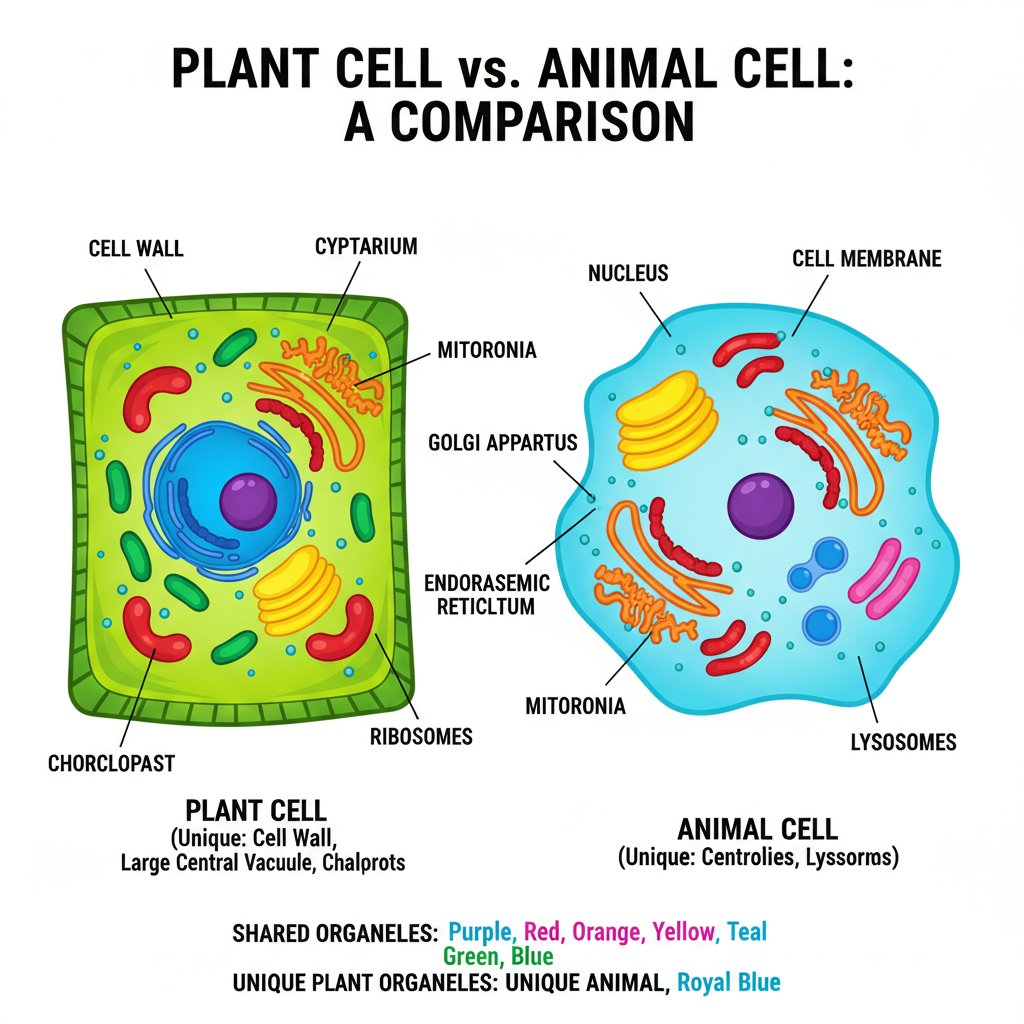
Side-by-side comparison of plant cell and animal cell, use vibrant distinct colors to highlight what they share vs what's unique, fill each organelle with rich colors, not just outlines, add captions and labels, make it textbook style, clean white background, high contrast, minimal shading, labeled callouts, professional color scientific illustration feel
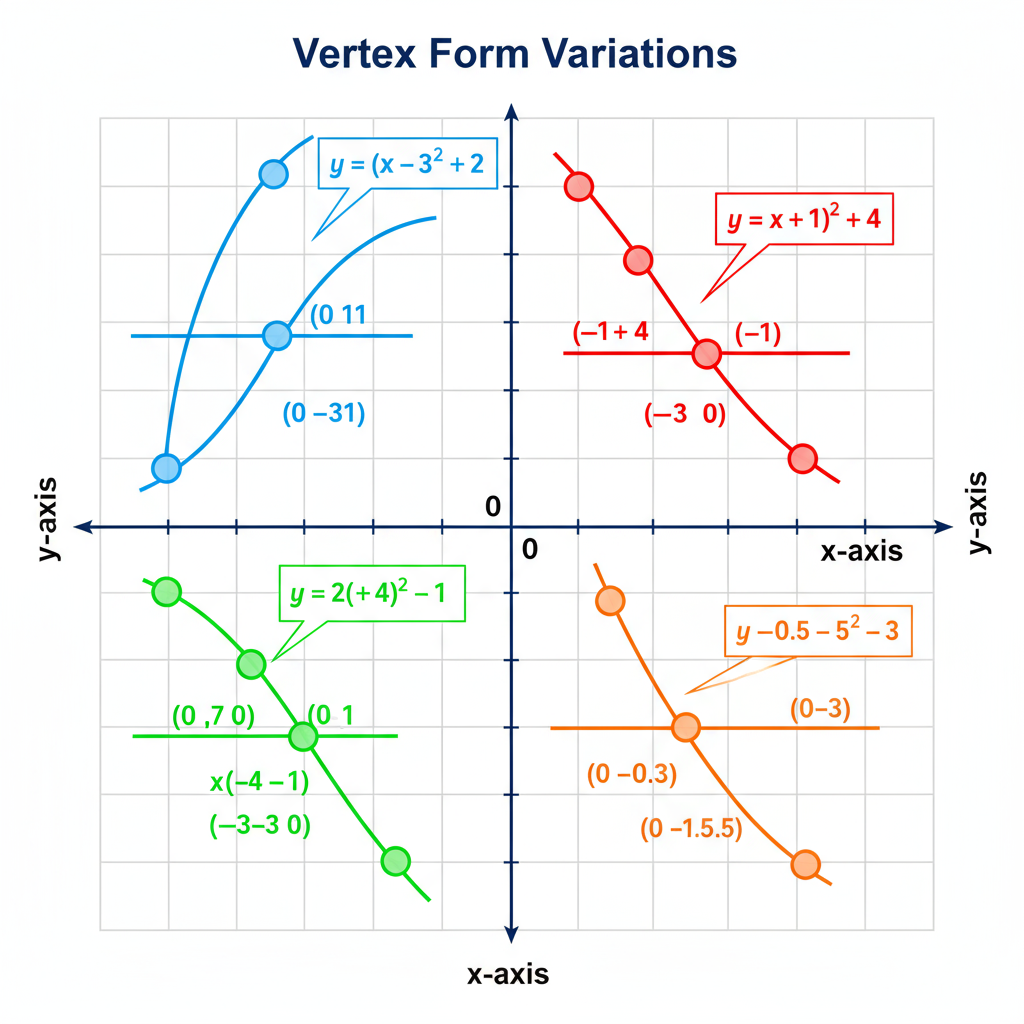
Draw a plot sheet of quadratic functions showing vertex form variations, label axes and intercepts, keep the grid subtle, use different vibrant colors for different curves (e.g., blue, red, green, orange), axes in dark colors, highlight key points (vertices, intercepts) with colored circles, use vibrant color fills, clean white background, high contrast, professional color scientific chart style
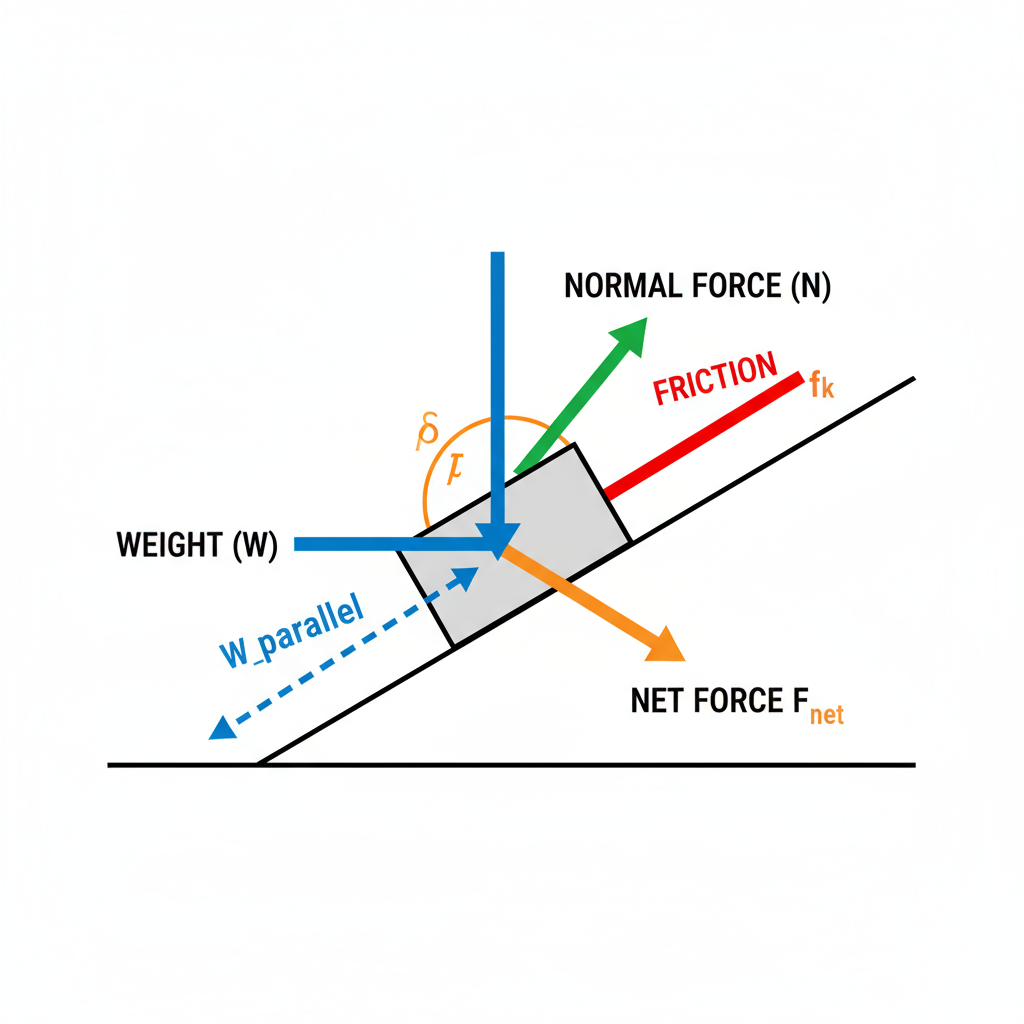
Draw a free-body diagram of a block on an inclined plane with friction, label normal force, weight components, friction, net force, angle labels too, use different colored arrows for different forces (e.g., weight in blue, normal force in green, friction in red, net force in orange), fill block with light gray, use vibrant color fills, clean white background, high contrast, professional color scientific illustration
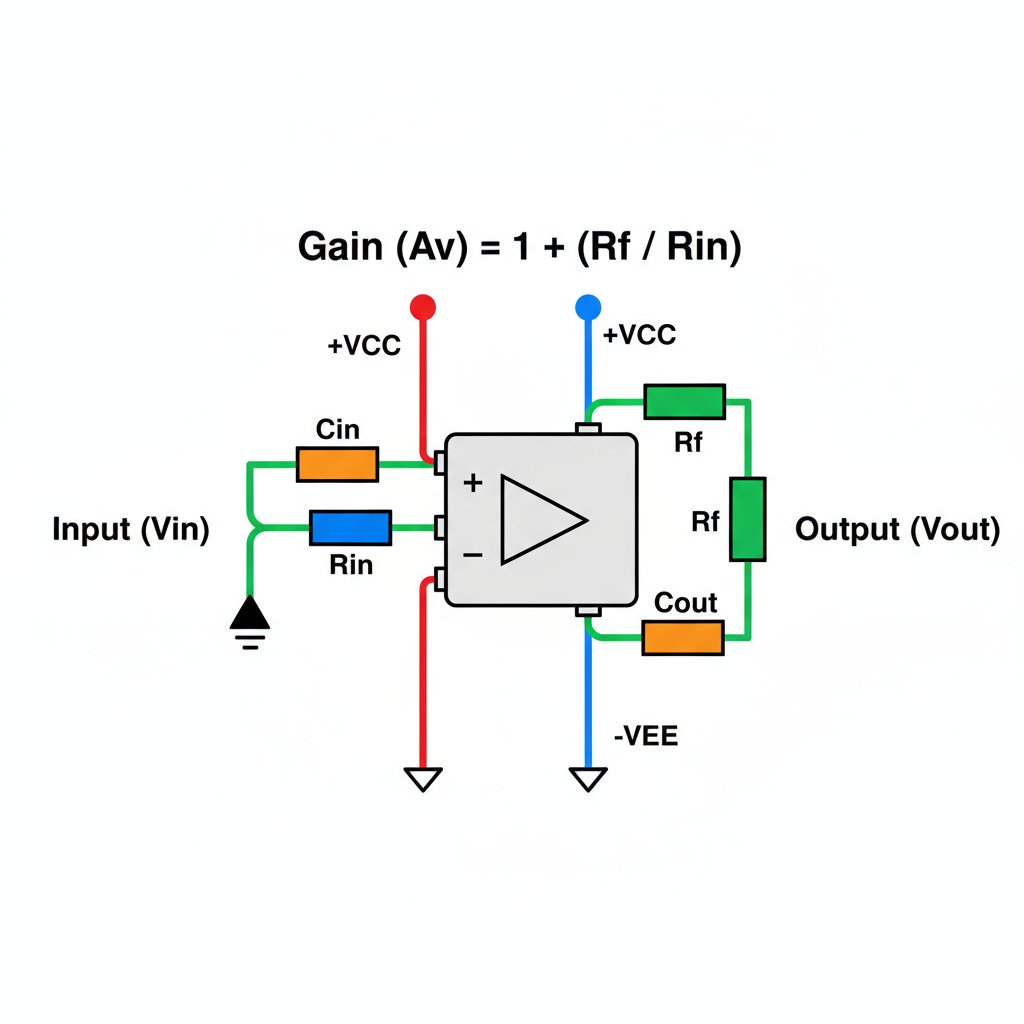
Draw a non-inverting op-amp amplifier with the gain formula annotated, use standard symbols, label inputs and outputs, fill resistors in different colors (e.g., blue, green), capacitors in orange, op-amp chip in light gray, use colored wires (positive in red, negative in blue, signal lines in green), use vibrant color fills, clean white background, high contrast, professional color scientific illustration
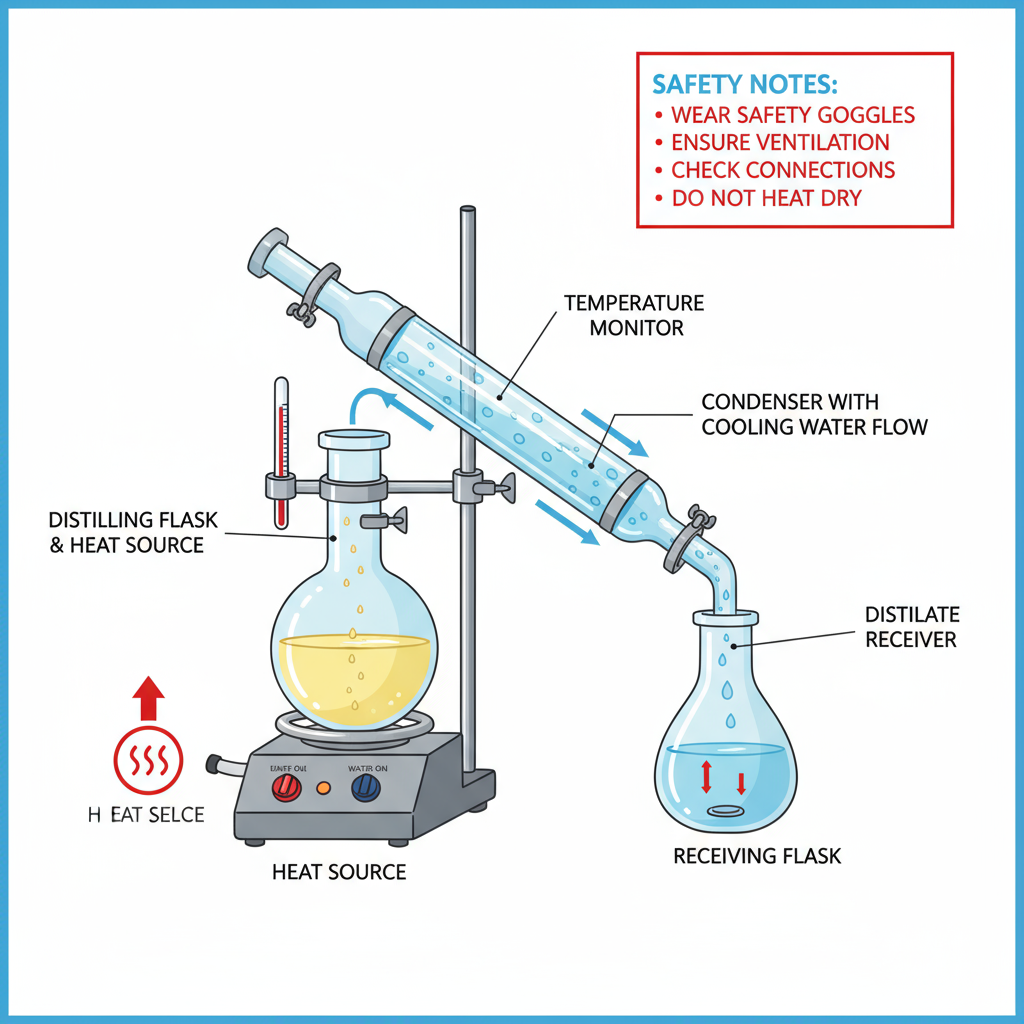
Draw a labeled distillation setup, include the heat source, condenser with flow arrows, receiving flask, plus safety notes, glassware in light blue or transparent effect, metal parts in silver or gray, liquids in light blue or yellow, arrows in red or blue, use vibrant color fills, clean white background, high contrast, labeled callouts with leader lines, professional color scientific illustration
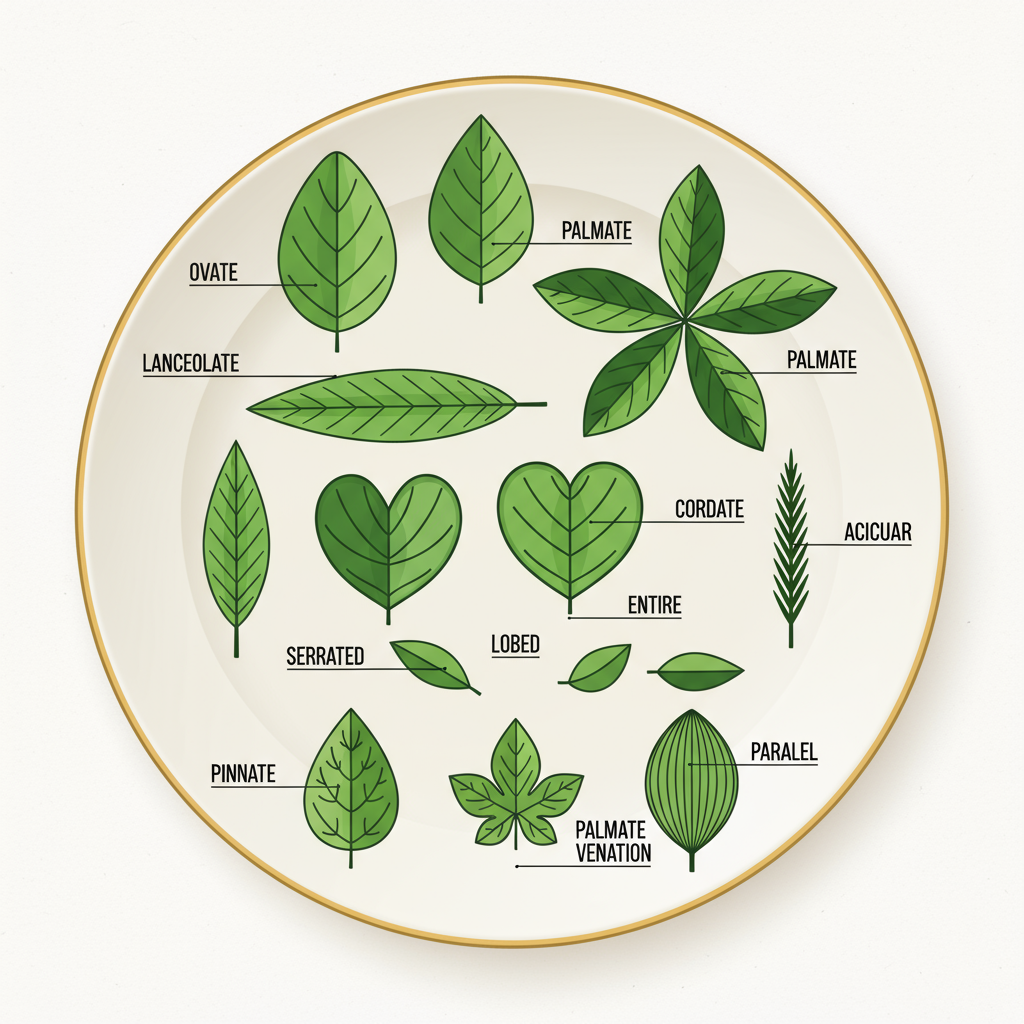
Make a plate showing different leaf shapes (ovate, lanceolate, palmate, etc.), margin types, and venation patterns. Label each one clearly, herbarium-style plate feel, fill leaves with various shades of green (light green, medium green, dark green), veins in dark green, use vibrant color fills, clean white background, high contrast, labeled callouts with leader lines, professional color scientific illustration
Your favorite companies are our partners
Draw science, instantly.
Create science & nature level science drawings in seconds
Professional-grade tools, generate scientific and natural themed illustrations in seconds.
Draw science, instantly.
Professional-grade tools, generate scientific and natural themed illustrations in seconds.


Words to Art
Describe, generate and refine visuals instantly
Tell AcaDraw what you want. See results in seconds and tweak until you love it.
Words to Art
Tell AcaDraw what you want. See results in seconds and tweak until you love it.
- Natural language prompts
- Instant live preview
- One‑click refinements
- Smart conversation flow


Powered by world‑class AI image models
Advanced AI generation for science drawing
High quality, intelligent and creative results for science & nature visuals. Powered by the Nano Banana and Seedream 4.0 models to deliver expressive palettes and publication-grade precision.
Fast AI generation
Create science drawing in seconds with AI.
Scientific accuracy
Precise technical details for research.
Natural language
Describe what you want in plain English or Chinese.
Interactive chat
Refine and iterate through conversational interface.
Multiple styles
Vector art, technical drawings, and scientific diagrams.
Easy to use
No technical skills required, just describe and create.
Pricing
Choose the plan that works best for you
Free
Basic features for personal academic use
- 10 free AI credits on registration, resets monthly
- AI science drawing generation (5 credits/use)
- AI diagrams: 3 credits/gen, 1 credit/edit
- Smart Convert to Editable SVG (1 credit/text, 3 credits/full)
- Standard quality output
- PNG format export
- Community support
- For personal educational use
Max
Enhanced AI credits for senior researchers
- 1,800 AI credits per month
- AI science drawing generation (5 credits/use)
- AI diagrams: 3 credits/gen, 1 credit/edit
- Smart Convert to Editable SVG (1 credit/text, 3 credits/full)
- High quality output
- PNG, JPG, SVG, PDF format export
- Priority email support
- Generation history saved for 90 days
- Watermark-free exports
- Publish in journals/commercial use license
Pro
More AI credits for individual scholars
- 500 AI credits per month
- AI science drawing generation (5 credits/use)
- AI diagrams: 3 credits/gen, 1 credit/edit
- Smart Convert to Editable SVG (1 credit/text, 3 credits/full)
- High quality output
- PNG, JPG, SVG, PDF format export
- Priority email support
- Generation history saved for 30 days
- Watermark-free exports
- Publish in journals/commercial use license
FAQ
Frequently Asked Questions
Testimonials
What researchers are saying
Dr. Lin Chen
Molecular BiologistAcaDraw turned microscopy findings into publication‑ready schematics in minutes.
Prof. Maya Singh
Organic ChemistReaction mechanisms and spectra plots are fast to compose and consistent.
Dr. Leo García
AstrophysicistArea charts and annotation tools made it easy to explain telescope data.
Dr. Sara Okoye
GeologistStratigraphy diagrams and cross‑sections are precise and export beautifully.
Dr. Hana Yamamoto
NeuroscientistNeural circuit sketches look hand‑drawn yet stay editable as vectors.
Dr. Amir Haddad
Materials ScientistCrystal lattices and process flows are clean and reproducible with seeds.
Dr. Olivia Martins
EcologistField data → polished figures. My lab now ships figures 3× faster.
Dr. Ethan Park
Physics EducatorI generate consistent diagrams for labs and exams in seconds.
Dr. Nadia Ivanova
OceanographerMap overlays and sections integrate smoothly with GIS exports.
Dr. Gabriel Rossi
Environmental EngineerCompliance reports need clear visuals—AcaDraw saves hours each week.
Dr. Priya Nair
PaleontologistMorphology plates are crisp; reviewers loved the clarity.
Dr. Ahmed Saleh
Data Visualization ScientistTemplates and prompt controls strike the right balance of speed and control.
Newsletter
Join the community
Subscribe to our newsletter for the latest news and updates